Common Bronzewing
Phaps chalcoptera
ABR description
The following is extracted from the Annual Bird Report for the twelve months to June 2017.
Common, breeding resident
This species is generally recorded in woodlands, on dry ridges of mountain forests and very occasionally in the suburbs.
General: 244 records down on 320 records last year from 59 grids up from 57 last year. There are downward trends in some metrics over the 10-year time frame. Notably, the reporting rate is down 57% and abundance is down 49% over the past ten years. The January 2003 fires may have resulted in the spikes recorded for 2007. Abundance is down 47% on last year and down 42% over the 30YA. The reporting rate is down 37% on last year and down 60% on the 30YA. Max 44/14 Apr Campbell Park (SmA1), mean 2.6, median 1. Two breeding records: earliest, nb/30 Dec ANBG (W S1), latest on/16 Jan Campbell Park (ClJ3).
GBS: While varying in detail, the broad pattern of decline in the General records is repeated in the GBS records. 66 records, down from 101 last year, from 7 sites down from 11 sites last year. Abundance is down 29% on last year and down 24% on the 30YA. Max 3/1wk May Wamboin GrQ12 (CoK2).

Abundance
Abundance is the average number of birds of that species per survey. Where the species was observed (presence recorded) but the number of birds seen was not recorded, this is treated as a count of zero.
Abundance by year
This chart shows the abundance of Common Bronzewing between 1982 and 2017. 
Abundance by month
This chart shows the monthly abundance of Common Bronzewing. The blue lines show the abundance for the twelve months to June 2017 and the bars show the average abundance for the period 1982 to 2017. 
Abundance by season
This chart shows the seasonal abundance of Common Bronzewing. The blue lines show the seasonal abundance for the twelve months to June 2017 and the bars show the average seasonal abundance for the period 1982 to 2017. 
Abundance data
| Month | Season | ||||||||||||||||||
|---|---|---|---|---|---|---|---|---|---|---|---|---|---|---|---|---|---|---|---|
| Period | Jul | Aug | Sep | Oct | Nov | Dec | Jan | Feb | Mar | Apr | May | Jun | Winter | Spring | Summer | Autumn | All | ||
| All years | |||||||||||||||||||
| All | 0.1 | 0.1 | 0.1 | 0.1 | 0.1 | 0.1 | 0.1 | 0.1 | 0.1 | 0.1 | 0.1 | 0.1 | 0.1 | 0.1 | 0.1 | 0.1 | 0.1 | ||
| Previous years | |||||||||||||||||||
| All previous years | 0.1 | 0.1 | 0.1 | 0.1 | 0.1 | 0.1 | 0.1 | 0.1 | 0.1 | 0.1 | 0.1 | 0.1 | 0.1 | 0.1 | 0.1 | 0.1 | 0.1 | ||
| Previous 30 years | 0.1 | 0.1 | 0.1 | 0.1 | 0.1 | 0.1 | 0.1 | 0.1 | 0.1 | 0.1 | 0.1 | 0.1 | 0.1 | 0.1 | 0.1 | 0.1 | 0.1 | ||
| Previous 20 years | 0.1 | 0.1 | 0.1 | 0.1 | 0.1 | 0.1 | 0.1 | 0.1 | 0.1 | 0.1 | 0.1 | 0.1 | 0.1 | 0.1 | 0.1 | 0.1 | 0.1 | ||
| 10 year groups | |||||||||||||||||||
| [2007,2017) | 0.1 | 0.1 | 0.1 | 0.1 | 0.1 | 0.1 | 0.1 | 0.1 | 0.1 | 0.1 | 0.1 | 0.1 | 0.1 | 0.1 | 0.1 | 0.1 | 0.1 | ||
| [1997,2007) | 0.1 | 0.1 | 0.1 | 0.1 | 0.1 | 0.0 | 0.1 | 0.1 | 0.1 | 0.1 | 0.1 | 0.1 | 0.1 | 0.1 | 0.1 | 0.1 | 0.1 | ||
| [1987,1997) | 0.1 | 0.0 | 0.1 | 0.1 | 0.1 | 0.1 | 0.1 | 0.1 | 0.0 | 0.1 | 0.1 | 0.0 | 0.0 | 0.1 | 0.1 | 0.1 | 0.1 | ||
| 5 year groups | |||||||||||||||||||
| [2012,2017) | 0.1 | 0.1 | 0.1 | 0.1 | 0.1 | 0.1 | 0.1 | 0.1 | 0.1 | 0.1 | 0.1 | 0.1 | 0.1 | 0.1 | 0.1 | 0.1 | 0.1 | ||
| [2007,2012) | 0.1 | 0.2 | 0.1 | 0.1 | 0.1 | 0.1 | 0.1 | 0.1 | 0.1 | 0.1 | 0.1 | 0.1 | 0.1 | 0.1 | 0.1 | 0.1 | 0.1 | ||
| [2002,2007) | 0.1 | 0.1 | 0.1 | 0.1 | 0.1 | 0.0 | 0.1 | 0.1 | 0.1 | 0.1 | 0.1 | 0.1 | 0.1 | 0.1 | 0.1 | 0.1 | 0.1 | ||
| [1997,2002) | 0.1 | 0.0 | 0.1 | 0.0 | 0.1 | 0.0 | 0.0 | 0.1 | 0.0 | 0.0 | 0.0 | 0.0 | 0.0 | 0.1 | 0.1 | 0.0 | 0.0 | ||
| [1992,1997) | 0.1 | 0.1 | 0.1 | 0.0 | 0.1 | 0.1 | 0.0 | 0.0 | 0.0 | 0.0 | 0.1 | 0.0 | 0.1 | 0.1 | 0.0 | 0.1 | 0.1 | ||
| [1987,1992) | 0.0 | 0.0 | 0.1 | 0.1 | 0.1 | 0.1 | 0.1 | 0.1 | 0.1 | 0.1 | 0.1 | 0.0 | 0.0 | 0.1 | 0.1 | 0.1 | 0.1 | ||
| Year | |||||||||||||||||||
| 2017 | 0.0 | 0.0 | 0.0 | 0.0 | 0.0 | 0.0 | 0.0 | 0.0 | 0.0 | 0.1 | 0.1 | 0.1 | 0.0 | 0.0 | 0.0 | 0.1 | 0.0 | ||
| 2016 | 0.2 | 0.1 | 0.1 | 0.1 | 0.1 | 0.0 | 0.1 | 0.0 | 0.1 | 0.1 | 0.1 | 0.1 | 0.1 | 0.1 | 0.1 | 0.1 | 0.1 | ||
| 2015 | 0.1 | 0.1 | 0.1 | 0.1 | 0.1 | 0.0 | 0.1 | 0.1 | 0.1 | 0.1 | 0.1 | 0.1 | 0.1 | 0.1 | 0.1 | 0.1 | 0.1 | ||
| 2014 | 0.1 | 0.0 | 0.0 | 0.1 | 0.1 | 0.1 | 0.1 | 0.1 | 0.1 | 0.2 | 0.0 | 0.0 | 0.0 | 0.1 | 0.1 | 0.1 | 0.1 | ||
| 2013 | 0.1 | 0.1 | 0.1 | 0.1 | 0.1 | 0.1 | 0.1 | 0.1 | 0.0 | 0.1 | 0.1 | 0.0 | 0.1 | 0.1 | 0.1 | 0.1 | 0.1 | ||
| 2012 | 0.0 | 0.1 | 0.0 | 0.1 | 0.0 | 0.1 | 0.1 | 0.1 | 0.1 | 0.1 | 0.1 | 0.1 | 0.1 | 0.1 | 0.1 | 0.1 | 0.1 | ||
| 2011 | 0.1 | 0.0 | 0.0 | 0.1 | 0.1 | 0.0 | 0.1 | 0.1 | 0.0 | 0.0 | 0.0 | 0.0 | 0.0 | 0.1 | 0.1 | 0.0 | 0.1 | ||
| 2010 | 0.2 | 0.2 | 0.1 | 0.1 | 0.1 | 0.1 | 0.0 | 0.0 | 0.1 | 0.1 | 0.2 | 0.0 | 0.1 | 0.1 | 0.1 | 0.1 | 0.1 | ||
| 2009 | 0.1 | 0.1 | 0.1 | 0.1 | 0.1 | 0.1 | 0.1 | 0.2 | 0.3 | 0.1 | 0.1 | 0.2 | 0.1 | 0.1 | 0.1 | 0.2 | 0.1 | ||
| 2008 | 0.2 | 0.2 | 0.1 | 0.1 | 0.1 | 0.1 | 0.2 | 0.0 | 0.1 | 0.1 | 0.1 | 0.2 | 0.2 | 0.1 | 0.1 | 0.1 | 0.1 | ||
| 2007 | 0.1 | 0.4 | 0.1 | 0.1 | 0.2 | 0.1 | 0.1 | 0.1 | 0.1 | 0.1 | 0.2 | 0.2 | 0.2 | 0.1 | 0.1 | 0.1 | 0.1 | ||
| 2006 | 0.1 | 0.2 | 0.1 | 0.1 | 0.1 | 0.1 | 0.1 | 0.1 | 0.1 | 0.1 | 0.1 | 0.1 | 0.1 | 0.1 | 0.1 | 0.1 | 0.1 | ||
| 2005 | 0.2 | 0.1 | 0.1 | 0.1 | 0.1 | 0.1 | 0.1 | 0.1 | 0.1 | 0.1 | 0.1 | 0.2 | 0.2 | 0.1 | 0.1 | 0.1 | 0.1 | ||
| 2004 | 0.1 | 0.2 | 0.1 | 0.0 | 0.0 | 0.0 | 0.0 | 0.1 | 0.1 | 0.2 | 0.2 | 0.0 | 0.1 | 0.1 | 0.1 | 0.2 | 0.1 | ||
| 2003 | 0.1 | 0.1 | 0.0 | 0.1 | 0.1 | 0.0 | 0.0 | 0.0 | 0.1 | 0.0 | 0.0 | 0.0 | 0.1 | 0.1 | 0.0 | 0.1 | 0.1 | ||
| 2002 | 0.1 | 0.0 | 0.0 | 0.0 | 0.0 | 0.1 | 0.0 | 0.1 | 0.0 | 0.1 | 0.1 | 0.0 | 0.0 | 0.0 | 0.0 | 0.0 | 0.0 | ||
| 2001 | 0.1 | 0.0 | 0.0 | 0.1 | 0.1 | 0.1 | 0.0 | 0.1 | 0.0 | 0.1 | 0.0 | 0.0 | 0.0 | 0.1 | 0.1 | 0.0 | 0.1 | ||
| 2000 | 0.1 | 0.0 | 0.0 | 0.1 | 0.1 | 0.0 | 0.0 | 0.1 | 0.1 | 0.0 | 0.2 | 0.0 | 0.0 | 0.1 | 0.1 | 0.1 | 0.1 | ||
| 1999 | 0.0 | 0.1 | 0.1 | 0.0 | 0.1 | 0.0 | 0.1 | 0.1 | 0.0 | 0.1 | 0.0 | 0.0 | 0.0 | 0.0 | 0.0 | 0.0 | 0.0 | ||
| 1998 | 0.0 | 0.1 | 0.1 | 0.0 | 0.0 | 0.0 | 0.0 | 0.1 | 0.0 | 0.0 | 0.1 | 0.0 | 0.0 | 0.0 | 0.0 | 0.0 | 0.0 | ||
| 1997 | 0.0 | 0.1 | 0.0 | 0.0 | 0.0 | 0.1 | 0.0 | 0.0 | 0.0 | 0.0 | 0.0 | 0.0 | 0.0 | 0.0 | 0.0 | 0.0 | 0.0 | ||
| 1996 | 0.1 | 0.0 | 0.0 | 0.0 | 0.1 | 0.1 | 0.1 | 0.0 | 0.0 | 0.0 | 0.0 | 0.0 | 0.0 | 0.1 | 0.1 | 0.0 | 0.0 | ||
| 1995 | 0.1 | 0.0 | 0.0 | 0.0 | 0.0 | 0.0 | 0.0 | 0.0 | 0.0 | 0.1 | 0.2 | 0.0 | 0.1 | 0.0 | 0.0 | 0.1 | 0.0 | ||
| 1994 | 0.0 | 0.0 | 0.0 | 0.0 | 0.0 | 0.1 | 0.0 | 0.0 | 0.1 | 0.0 | 0.0 | 0.0 | 0.0 | 0.0 | 0.0 | 0.0 | 0.0 | ||
| 1993 | 0.0 | 0.1 | 0.0 | 0.0 | 0.1 | 0.1 | 0.0 | 0.1 | 0.0 | 0.0 | 0.1 | 0.0 | 0.0 | 0.0 | 0.1 | 0.1 | 0.0 | ||
| 1992 | 0.1 | 0.3 | 0.2 | 0.1 | 0.2 | 0.0 | 0.1 | 0.0 | 0.1 | 0.0 | 0.2 | 0.0 | 0.1 | 0.2 | 0.0 | 0.1 | 0.1 | ||
| 1991 | 0.1 | 0.0 | 0.1 | 0.0 | 0.0 | 0.0 | 0.1 | 0.1 | 0.1 | 0.1 | 0.2 | 0.2 | 0.1 | 0.0 | 0.0 | 0.1 | 0.1 | ||
| 1990 | 0.0 | 0.0 | 0.0 | 0.0 | 0.0 | 0.0 | 0.1 | 0.0 | 0.0 | 0.1 | 0.1 | 0.0 | 0.0 | 0.0 | 0.1 | 0.1 | 0.0 | ||
| 1989 | 0.0 | 0.0 | 0.0 | 0.1 | 0.1 | 0.1 | 0.1 | 0.1 | 0.1 | 0.1 | 0.0 | 0.0 | 0.0 | 0.1 | 0.1 | 0.1 | 0.1 | ||
| 1988 | 0.0 | 0.1 | 0.1 | 0.1 | 0.1 | 0.0 | 0.1 | 0.1 | 0.0 | 0.1 | 0.0 | 0.0 | 0.0 | 0.1 | 0.1 | 0.1 | 0.1 | ||
| 1987 | 0.6 | 0.0 | 0.1 | 0.0 | 0.1 | 0.0 | 0.1 | 0.1 | 0.0 | 0.0 | 0.0 | 0.0 | 0.1 | 0.1 | 0.1 | 0.0 | 0.1 | ||
| 1986 | 0.0 | 0.0 | 0.0 | 0.1 | 0.0 | 0.1 | 0.2 | 0.1 | 0.0 | 0.0 | 0.0 | 0.1 | 0.1 | 0.0 | 0.1 | 0.0 | 0.1 | ||
| 1985 | 0.3 | 0.0 | 0.0 | 0.1 | 0.1 | 0.0 | 0.2 | 0.1 | 0.1 | 0.1 | 0.2 | 0.1 | 0.1 | 0.1 | 0.1 | 0.1 | 0.1 | ||
| 1984 | 0.0 | 0.0 | 0.0 | 0.0 | 0.0 | 0.0 | 0.0 | 0.0 | 0.0 | 0.1 | 0.2 | 0.1 | 0.0 | 0.0 | 0.0 | 0.1 | 0.0 | ||
| 1983 | 0.0 | 0.0 | 0.0 | 0.0 | 0.0 | 0.0 | 0.0 | 0.0 | 0.0 | - | 0.0 | 0.0 | 0.0 | 0.0 | 0.0 | 0.0 | 0.0 | ||
| 1982 | - | 0.0 | - | 0.0 | 0.0 | 0.0 | - | 0.0 | - | 0.0 | - | 0.0 | 0.0 | 0.0 | 0.0 | 0.0 | 0.0 | ||
Reporting rates
Reporting rate is the proportion of all surveys in which the species was present.
Reporting rate by year
This chart shows the reporting rate of Common Bronzewing each year between 1982 and 2017. 
Reporting rate by month
This chart shows the reporting rate by month of Common Bronzewing. The blue lines show the reporting rate for the twelve months to June 2017 and the bars show the average reporting rate for the period 1982 to 2017. 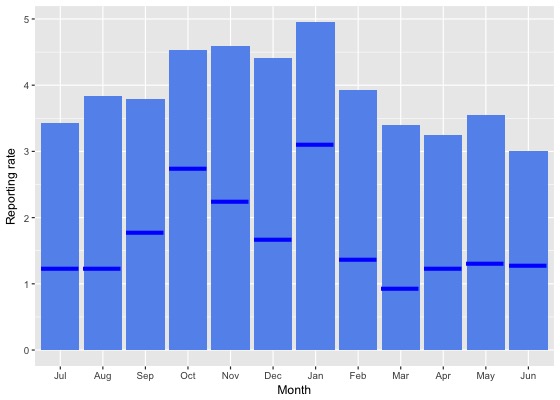
Reporting rate by season
This chart shows the seasonal reporting rate of Common Bronzewing. The blue lines show the seasonal reporting rate for the twelve months to June 2017 and the bars show the average seasonal reporting rate for the period 1982 to 2017. 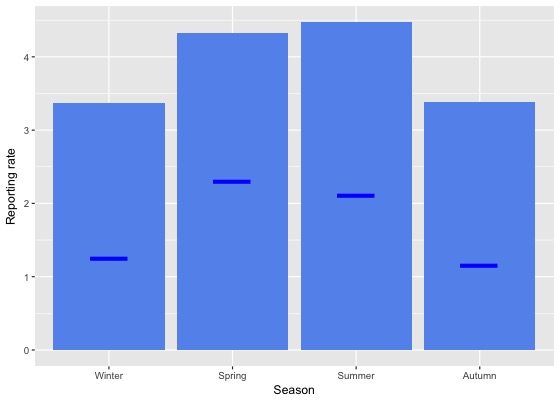
Reporting rate data
| Month | Season | ||||||||||||||||||
|---|---|---|---|---|---|---|---|---|---|---|---|---|---|---|---|---|---|---|---|
| Period | Jul | Aug | Sep | Oct | Nov | Dec | Jan | Feb | Mar | Apr | May | Jun | Winter | Spring | Summer | Autumn | All | ||
| All years | |||||||||||||||||||
| All | 3.4 | 3.8 | 3.8 | 4.5 | 4.6 | 4.4 | 4.9 | 3.9 | 3.4 | 3.2 | 3.5 | 3.0 | 3.4 | 4.3 | 4.5 | 3.4 | 3.9 | ||
| Previous years | |||||||||||||||||||
| All previous years | 3.8 | 4.3 | 4.1 | 4.8 | 5.0 | 4.8 | 5.3 | 4.5 | 3.8 | 3.6 | 4.1 | 3.3 | 3.8 | 4.6 | 4.9 | 3.8 | 4.3 | ||
| Previous 30 years | 3.8 | 4.4 | 4.1 | 4.8 | 5.0 | 4.9 | 5.3 | 4.5 | 3.8 | 3.6 | 4.0 | 3.3 | 3.8 | 4.7 | 4.9 | 3.8 | 4.3 | ||
| Previous 20 years | 4.0 | 4.8 | 4.0 | 4.8 | 4.8 | 4.8 | 5.0 | 4.3 | 3.8 | 3.5 | 4.2 | 3.4 | 4.0 | 4.6 | 4.7 | 3.8 | 4.3 | ||
| 10 year groups | |||||||||||||||||||
| [2007,2017) | 3.7 | 4.4 | 3.6 | 4.7 | 4.5 | 4.6 | 4.9 | 3.6 | 3.6 | 3.2 | 4.1 | 3.1 | 3.6 | 4.3 | 4.5 | 3.6 | 4.1 | ||
| [1997,2007) | 4.5 | 5.6 | 4.8 | 5.2 | 5.5 | 5.2 | 5.0 | 6.2 | 4.1 | 4.3 | 4.5 | 4.0 | 4.6 | 5.2 | 5.4 | 4.3 | 4.9 | ||
| [1987,1997) | 3.0 | 3.3 | 4.7 | 4.6 | 5.6 | 5.4 | 7.2 | 5.4 | 4.0 | 4.0 | 3.4 | 2.9 | 3.1 | 5.0 | 6.0 | 3.8 | 4.5 | ||
| 5 year groups | |||||||||||||||||||
| [2012,2017) | 3.3 | 3.5 | 2.8 | 4.0 | 3.4 | 3.9 | 4.3 | 2.9 | 3.0 | 2.5 | 3.2 | 2.1 | 2.9 | 3.5 | 3.8 | 2.9 | 3.3 | ||
| [2007,2012) | 4.9 | 7.5 | 5.4 | 6.0 | 7.6 | 6.1 | 7.3 | 6.6 | 5.3 | 4.9 | 6.6 | 5.0 | 5.5 | 6.1 | 6.6 | 5.4 | 6.0 | ||
| [2002,2007) | 5.0 | 7.8 | 5.7 | 6.4 | 6.2 | 5.5 | 5.7 | 5.8 | 4.4 | 5.0 | 5.8 | 5.2 | 5.8 | 6.1 | 5.6 | 4.9 | 5.6 | ||
| [1997,2002) | 3.7 | 3.0 | 3.8 | 3.5 | 4.6 | 4.9 | 4.3 | 6.7 | 3.8 | 3.4 | 3.0 | 2.4 | 3.0 | 4.0 | 5.2 | 3.5 | 4.0 | ||
| [1992,1997) | 2.8 | 2.5 | 3.8 | 2.8 | 4.3 | 3.5 | 2.8 | 4.3 | 1.8 | 2.3 | 2.7 | 1.5 | 2.2 | 3.6 | 3.5 | 2.2 | 2.9 | ||
| [1987,1992) | 3.1 | 3.7 | 5.2 | 5.7 | 6.2 | 6.3 | 9.6 | 5.8 | 5.3 | 4.9 | 3.8 | 3.7 | 3.5 | 5.7 | 7.2 | 4.7 | 5.3 | ||
| Year | |||||||||||||||||||
| 2017 | 1.2 | 1.2 | 1.8 | 2.7 | 2.2 | 1.7 | 3.1 | 1.4 | 0.9 | 1.2 | 1.3 | 1.3 | 1.3 | 2.3 | 2.1 | 1.2 | 1.7 | ||
| 2016 | 4.1 | 2.8 | 2.8 | 2.7 | 3.2 | 2.9 | 3.7 | 1.7 | 2.5 | 2.4 | 2.7 | 1.9 | 2.9 | 2.8 | 2.8 | 2.5 | 2.7 | ||
| 2015 | 2.3 | 5.6 | 2.8 | 3.7 | 2.8 | 3.4 | 2.6 | 2.3 | 2.7 | 2.0 | 3.5 | 2.2 | 3.2 | 3.2 | 2.8 | 2.7 | 2.9 | ||
| 2014 | 3.6 | 3.4 | 2.3 | 4.9 | 4.8 | 4.9 | 5.3 | 3.9 | 3.6 | 2.6 | 3.7 | 1.3 | 2.4 | 4.1 | 4.8 | 3.3 | 3.8 | ||
| 2013 | 4.1 | 2.7 | 3.6 | 6.2 | 4.4 | 4.8 | 6.8 | 5.6 | 3.8 | 2.6 | 3.8 | 2.9 | 3.2 | 4.9 | 5.7 | 3.3 | 4.5 | ||
| 2012 | 2.0 | 2.8 | 2.4 | 4.1 | 2.7 | 4.9 | 4.6 | 5.4 | 3.9 | 3.6 | 2.7 | 2.7 | 2.5 | 3.3 | 4.8 | 3.5 | 3.6 | ||
| 2011 | 4.1 | 0.8 | 2.7 | 4.2 | 8.5 | 2.7 | 8.3 | 6.4 | 2.5 | 2.5 | 3.3 | 2.3 | 2.4 | 4.6 | 5.7 | 2.7 | 4.0 | ||
| 2010 | 6.2 | 11.4 | 3.4 | 7.6 | 7.2 | 4.4 | 4.3 | 4.7 | 7.5 | 5.5 | 7.8 | 4.2 | 6.4 | 6.3 | 4.4 | 6.8 | 6.0 | ||
| 2009 | 4.3 | 6.2 | 3.8 | 5.5 | 6.2 | 5.3 | 8.7 | 11.7 | 7.9 | 6.6 | 8.4 | 5.0 | 5.0 | 5.2 | 8.1 | 7.5 | 6.2 | ||
| 2008 | 6.2 | 10.4 | 7.1 | 6.4 | 8.7 | 7.2 | 10.3 | 3.7 | 4.3 | 4.0 | 6.3 | 5.6 | 7.0 | 6.9 | 7.2 | 4.5 | 6.4 | ||
| 2007 | 3.3 | 9.3 | 10.4 | 6.3 | 8.1 | 11.1 | 6.3 | 6.1 | 5.1 | 6.8 | 11.4 | 8.1 | 7.5 | 7.8 | 8.4 | 7.1 | 7.7 | ||
| 2006 | 7.9 | 10.7 | 5.3 | 7.2 | 6.0 | 3.9 | 4.5 | 7.4 | 3.8 | 6.5 | 5.1 | 3.8 | 6.4 | 6.4 | 5.1 | 4.8 | 5.7 | ||
| 2005 | 4.4 | 5.6 | 5.6 | 8.8 | 9.7 | 6.4 | 12.1 | 6.5 | 4.8 | 3.8 | 5.5 | 8.4 | 6.7 | 7.6 | 8.1 | 4.7 | 6.7 | ||
| 2004 | 5.6 | 9.9 | 7.7 | 2.9 | 3.5 | 5.5 | 3.6 | 7.1 | 4.7 | 6.0 | 8.7 | 2.5 | 5.8 | 4.9 | 5.2 | 6.1 | 5.5 | ||
| 2003 | 4.3 | 10.1 | 4.7 | 7.8 | 6.9 | 5.5 | 5.2 | 3.8 | 7.6 | 3.2 | 4.7 | 5.6 | 6.7 | 6.3 | 4.9 | 5.3 | 5.8 | ||
| 2002 | 2.9 | 1.7 | 5.5 | 4.7 | 5.5 | 5.6 | 3.8 | 5.3 | 1.4 | 6.0 | 5.9 | 4.8 | 3.3 | 5.2 | 5.1 | 3.8 | 4.5 | ||
| 2001 | 4.0 | 1.8 | 3.0 | 4.2 | 6.8 | 8.3 | 5.0 | 7.7 | 3.3 | 4.4 | 2.9 | 4.9 | 3.7 | 4.3 | 7.2 | 3.5 | 4.7 | ||
| 2000 | 4.8 | 2.6 | 4.2 | 4.4 | 6.0 | 1.7 | 5.0 | 7.6 | 5.7 | 2.7 | 4.5 | 2.2 | 3.0 | 4.9 | 4.4 | 4.3 | 4.2 | ||
| 1999 | 2.9 | 4.1 | 4.0 | 3.1 | 5.2 | 5.0 | 5.1 | 6.4 | 4.3 | 3.6 | 2.3 | 1.4 | 2.3 | 4.1 | 5.5 | 3.4 | 3.9 | ||
| 1998 | 2.7 | 3.8 | 6.5 | 2.2 | 0.0 | 1.9 | 0.0 | 3.8 | 1.1 | 2.6 | 3.7 | 1.3 | 2.4 | 3.0 | 1.8 | 1.9 | 2.4 | ||
| 1997 | 2.3 | 5.2 | 1.8 | 1.3 | 2.6 | 7.7 | 2.0 | 3.5 | 0.0 | 2.8 | 2.2 | 0.0 | 2.3 | 2.0 | 5.2 | 2.1 | 2.8 | ||
| 1996 | 4.5 | 1.1 | 4.0 | 2.6 | 3.7 | 5.1 | 4.9 | 3.5 | 1.0 | 1.6 | 1.7 | 2.3 | 2.4 | 3.4 | 4.5 | 1.3 | 3.0 | ||
| 1995 | 3.2 | 1.6 | 2.9 | 1.8 | 1.8 | 1.1 | 1.8 | 4.8 | 1.0 | 2.4 | 3.9 | 2.1 | 2.2 | 2.1 | 2.3 | 2.3 | 2.2 | ||
| 1994 | 3.9 | 1.3 | 4.4 | 4.7 | 2.2 | 4.3 | 0.0 | 3.4 | 4.5 | 3.1 | 2.5 | 2.2 | 2.3 | 3.4 | 2.3 | 3.3 | 3.0 | ||
| 1993 | 0.0 | 5.1 | 0.0 | 2.7 | 6.1 | 4.3 | 2.0 | 6.2 | 0.0 | 1.7 | 1.3 | 0.0 | 2.0 | 3.0 | 3.9 | 0.9 | 2.3 | ||
| 1992 | 1.5 | 5.6 | 7.1 | 3.2 | 11.1 | 3.2 | 5.2 | 4.9 | 2.8 | 1.7 | 3.9 | 0.0 | 2.2 | 6.8 | 4.3 | 2.9 | 4.3 | ||
| 1991 | 1.6 | 1.1 | 4.7 | 1.9 | 2.1 | 0.0 | 7.1 | 2.0 | 3.2 | 5.1 | 4.9 | 6.0 | 2.2 | 2.8 | 2.8 | 4.4 | 2.9 | ||
| 1990 | 3.2 | 2.7 | 4.3 | 2.0 | 2.8 | 5.6 | 8.3 | 4.2 | 1.1 | 3.6 | 4.1 | 2.6 | 2.9 | 3.0 | 6.0 | 2.9 | 3.5 | ||
| 1989 | 3.1 | 3.0 | 4.8 | 8.1 | 11.1 | 12.2 | 9.0 | 5.7 | 10.0 | 5.6 | 3.9 | 4.2 | 3.4 | 7.9 | 9.2 | 6.6 | 6.8 | ||
| 1988 | 3.0 | 5.6 | 5.1 | 7.8 | 6.6 | 4.1 | 8.0 | 6.9 | 5.0 | 7.0 | 4.0 | 3.9 | 4.2 | 6.6 | 6.3 | 5.3 | 5.6 | ||
| 1987 | 18.2 | 6.7 | 6.1 | 3.9 | 5.4 | 4.3 | 12.8 | 6.2 | 3.8 | 3.3 | 3.1 | 2.9 | 3.9 | 5.1 | 7.6 | 3.4 | 5.2 | ||
| 1986 | 3.8 | 2.6 | 1.9 | 5.6 | 4.3 | 2.9 | 8.7 | 2.8 | 3.2 | 2.0 | 3.4 | 8.6 | 5.1 | 3.7 | 4.3 | 2.7 | 3.9 | ||
| 1985 | 3.3 | 3.3 | 0.0 | 1.2 | 3.5 | 1.7 | 12.5 | 5.9 | 9.1 | 5.3 | 20.0 | 3.6 | 3.4 | 1.5 | 3.5 | 10.0 | 3.2 | ||
| 1984 | 0.0 | 0.0 | 0.0 | 0.0 | 0.0 | 0.0 | 3.4 | 0.0 | 3.7 | 2.9 | 6.5 | 2.9 | 2.0 | 0.0 | 1.4 | 4.3 | 2.5 | ||
| 1983 | 0.0 | 0.0 | 0.0 | 0.0 | 0.0 | 0.0 | 0.0 | 0.0 | 0.0 | - | 0.0 | 0.0 | 0.0 | 0.0 | 0.0 | 0.0 | 0.0 | ||
| 1982 | - | 0.0 | - | 0.0 | 0.0 | 0.0 | - | 0.0 | - | 0.0 | - | 0.0 | 0.0 | 0.0 | 0.0 | 0.0 | 0.0 | ||
Breeding data
Breeding records by month
Number of breeding records by breeding code and month, 2017 and all years| Breeding code | Jul | Aug | Sep | Oct | Nov | Dec | Jan | Feb | Mar | Apr | May | Jun |
|---|---|---|---|---|---|---|---|---|---|---|---|---|
| 2017 | ||||||||||||
| Breeding (BLA code) | 0 | 0 | 0 | 0 | 0 | 0 | 0 | 0 | 0 | 0 | 0 | 0 |
| Carrying Food | 0 | 0 | 0 | 0 | 0 | 0 | 0 | 0 | 0 | 0 | 0 | 0 |
| Copulating | 0 | 0 | 0 | 0 | 0 | 0 | 0 | 0 | 0 | 0 | 0 | 0 |
| Display | 0 | 0 | 0 | 0 | 0 | 0 | 0 | 0 | 0 | 0 | 0 | 0 |
| Dependent young | 0 | 0 | 0 | 0 | 0 | 0 | 0 | 0 | 0 | 0 | 0 | 0 |
| Faecal sac | 0 | 0 | 0 | 0 | 0 | 0 | 0 | 0 | 0 | 0 | 0 | 0 |
| Inspecting hollow | 0 | 0 | 0 | 0 | 0 | 0 | 0 | 0 | 0 | 0 | 0 | 0 |
| Nest building | 0 | 0 | 0 | 0 | 0 | 1 | 0 | 0 | 0 | 0 | 0 | 0 |
| Nest with eggs | 0 | 0 | 0 | 0 | 0 | 0 | 0 | 0 | 0 | 0 | 0 | 0 |
| Nest with young | 0 | 0 | 0 | 0 | 0 | 0 | 0 | 0 | 0 | 0 | 0 | 0 |
| On/leaving nest | 0 | 0 | 0 | 0 | 0 | 0 | 1 | 0 | 0 | 0 | 0 | 0 |
| All years | ||||||||||||
| Breeding (BLA code) | 0 | 0 | 0 | 0 | 0 | 0 | 3 | 0 | 0 | 0 | 0 | 0 |
| Carrying Food | 0 | 0 | 0 | 0 | 0 | 0 | 0 | 0 | 0 | 0 | 0 | 0 |
| Copulating | 0 | 0 | 0 | 0 | 1 | 1 | 0 | 0 | 0 | 0 | 0 | 0 |
| Display | 0 | 0 | 0 | 0 | 1 | 1 | 0 | 0 | 0 | 0 | 0 | 0 |
| Dependent young | 0 | 0 | 0 | 0 | 1 | 0 | 1 | 0 | 0 | 0 | 0 | 0 |
| Faecal sac | 0 | 0 | 0 | 0 | 0 | 0 | 0 | 0 | 0 | 0 | 0 | 0 |
| Inspecting hollow | 0 | 0 | 0 | 0 | 0 | 0 | 0 | 0 | 0 | 0 | 0 | 0 |
| Nest building | 0 | 0 | 0 | 2 | 3 | 3 | 2 | 0 | 0 | 0 | 0 | 0 |
| Nest with eggs | 0 | 0 | 1 | 1 | 1 | 3 | 1 | 0 | 0 | 0 | 0 | 0 |
| Nest with young | 0 | 0 | 0 | 0 | 1 | 0 | 0 | 1 | 0 | 0 | 0 | 0 |
| On/leaving nest | 0 | 3 | 3 | 1 | 10 | 5 | 6 | 1 | 0 | 0 | 0 | 0 |
Breeding records by year
Average number of breeding records per period by breeding code| Period | Breeding (BLA code) | Carrying Food | Copulating | Display | Dependent young | Faecal sac | Inspecting hollow | Nest building | Nest with eggs | Nest with young | On/leaving nest |
|---|---|---|---|---|---|---|---|---|---|---|---|
| All years | |||||||||||
| All | 0.1 | 0.0 | 0.1 | 0.1 | 0.1 | 0.0 | 0.0 | 0.3 | 0.2 | 0.1 | 0.8 |
| Previous years | |||||||||||
| All previous years | 0.1 | 0.0 | 0.1 | 0.1 | 0.1 | 0.0 | 0.0 | 0.3 | 0.2 | 0.1 | 0.8 |
| Previous 30 years | 0.1 | 0.0 | 0.1 | 0.1 | 0.1 | 0.0 | 0.0 | 0.3 | 0.2 | 0.1 | 0.9 |
| Previous 20 years | 0.1 | 0.0 | 0.1 | 0.1 | 0.1 | 0.0 | 0.0 | 0.5 | 0.0 | 0.1 | 1.2 |
| 10 year groups | |||||||||||
| [2007,2017) | 0.2 | 0.0 | 0.2 | 0.2 | 0.2 | 0.0 | 0.0 | 0.9 | 0.0 | 0.2 | 1.8 |
| [1997,2007) | 0.1 | 0.0 | 0.0 | 0.0 | 0.0 | 0.0 | 0.0 | 0.0 | 0.0 | 0.0 | 0.7 |
| [1987,1997) | 0.0 | 0.0 | 0.0 | 0.0 | 0.0 | 0.0 | 0.0 | 0.0 | 0.7 | 0.0 | 0.3 |
| 5 year groups | |||||||||||
| [2012,2017) | 0.2 | 0.0 | 0.4 | 0.4 | 0.4 | 0.0 | 0.0 | 0.4 | 0.0 | 0.0 | 1.8 |
| [2007,2012) | 0.2 | 0.0 | 0.0 | 0.0 | 0.0 | 0.0 | 0.0 | 1.4 | 0.0 | 0.4 | 1.8 |
| [2002,2007) | 0.0 | 0.0 | 0.0 | 0.0 | 0.0 | 0.0 | 0.0 | 0.0 | 0.0 | 0.0 | 0.8 |
| [1997,2002) | 0.2 | 0.0 | 0.0 | 0.0 | 0.0 | 0.0 | 0.0 | 0.0 | 0.0 | 0.0 | 0.6 |
| [1992,1997) | 0.0 | 0.0 | 0.0 | 0.0 | 0.0 | 0.0 | 0.0 | 0.0 | 0.0 | 0.0 | 0.6 |
| [1987,1992) | 0.0 | 0.0 | 0.0 | 0.0 | 0.0 | 0.0 | 0.0 | 0.0 | 1.4 | 0.0 | 0.0 |
| Year | |||||||||||
| 2017 | 0.0 | 0.0 | 0.0 | 0.0 | 0.0 | 0.0 | 0.0 | 1.0 | 0.0 | 0.0 | 1.0 |
| 2016 | 0.0 | 0.0 | 1.0 | 0.0 | 2.0 | 0.0 | 0.0 | 2.0 | 0.0 | 0.0 | 1.0 |
| 2015 | 0.0 | 0.0 | 0.0 | 0.0 | 0.0 | 0.0 | 0.0 | 0.0 | 0.0 | 0.0 | 2.0 |
| 2014 | 0.0 | 0.0 | 0.0 | 0.0 | 0.0 | 0.0 | 0.0 | 0.0 | 0.0 | 0.0 | 0.0 |
| 2013 | 0.0 | 0.0 | 0.0 | 0.0 | 0.0 | 0.0 | 0.0 | 0.0 | 0.0 | 0.0 | 5.0 |
| 2012 | 1.0 | 0.0 | 1.0 | 2.0 | 0.0 | 0.0 | 0.0 | 0.0 | 0.0 | 0.0 | 1.0 |
| 2011 | 1.0 | 0.0 | 0.0 | 0.0 | 0.0 | 0.0 | 0.0 | 2.0 | 0.0 | 0.0 | 4.0 |
| 2010 | 0.0 | 0.0 | 0.0 | 0.0 | 0.0 | 0.0 | 0.0 | 2.0 | 0.0 | 0.0 | 1.0 |
| 2009 | 0.0 | 0.0 | 0.0 | 0.0 | 0.0 | 0.0 | 0.0 | 1.0 | 0.0 | 2.0 | 1.0 |
| 2008 | 0.0 | 0.0 | 0.0 | 0.0 | 0.0 | 0.0 | 0.0 | 1.0 | 0.0 | 0.0 | 1.0 |
| 2007 | 0.0 | 0.0 | 0.0 | 0.0 | 0.0 | 0.0 | 0.0 | 1.0 | 0.0 | 0.0 | 2.0 |
| 2006 | 0.0 | 0.0 | 0.0 | 0.0 | 0.0 | 0.0 | 0.0 | 0.0 | 0.0 | 0.0 | 0.0 |
| 2005 | 0.0 | 0.0 | 0.0 | 0.0 | 0.0 | 0.0 | 0.0 | 0.0 | 0.0 | 0.0 | 3.0 |
| 2004 | 0.0 | 0.0 | 0.0 | 0.0 | 0.0 | 0.0 | 0.0 | 0.0 | 0.0 | 0.0 | 0.0 |
| 2003 | 0.0 | 0.0 | 0.0 | 0.0 | 0.0 | 0.0 | 0.0 | 0.0 | 0.0 | 0.0 | 1.0 |
| 2002 | 0.0 | 0.0 | 0.0 | 0.0 | 0.0 | 0.0 | 0.0 | 0.0 | 0.0 | 0.0 | 0.0 |
| 2001 | 0.0 | 0.0 | 0.0 | 0.0 | 0.0 | 0.0 | 0.0 | 0.0 | 0.0 | 0.0 | 1.0 |
| 2000 | 0.0 | 0.0 | 0.0 | 0.0 | 0.0 | 0.0 | 0.0 | 0.0 | 0.0 | 0.0 | 2.0 |
| 1999 | 1.0 | 0.0 | 0.0 | 0.0 | 0.0 | 0.0 | 0.0 | 0.0 | 0.0 | 0.0 | 0.0 |
| 1998 | 0.0 | 0.0 | 0.0 | 0.0 | 0.0 | 0.0 | 0.0 | 0.0 | 0.0 | 0.0 | 0.0 |
| 1997 | 0.0 | 0.0 | 0.0 | 0.0 | 0.0 | 0.0 | 0.0 | 0.0 | 0.0 | 0.0 | 0.0 |
| 1996 | 0.0 | 0.0 | 0.0 | 0.0 | 0.0 | 0.0 | 0.0 | 0.0 | 0.0 | 0.0 | 0.0 |
| 1995 | 0.0 | 0.0 | 0.0 | 0.0 | 0.0 | 0.0 | 0.0 | 0.0 | 0.0 | 0.0 | 0.0 |
| 1994 | 0.0 | 0.0 | 0.0 | 0.0 | 0.0 | 0.0 | 0.0 | 0.0 | 0.0 | 0.0 | 0.0 |
| 1993 | 0.0 | 0.0 | 0.0 | 0.0 | 0.0 | 0.0 | 0.0 | 0.0 | 0.0 | 0.0 | 2.0 |
| 1992 | 0.0 | 0.0 | 0.0 | 0.0 | 0.0 | 0.0 | 0.0 | 0.0 | 0.0 | 0.0 | 1.0 |
| 1991 | 0.0 | 0.0 | 0.0 | 0.0 | 0.0 | 0.0 | 0.0 | 0.0 | 0.0 | 0.0 | 0.0 |
| 1990 | 0.0 | 0.0 | 0.0 | 0.0 | 0.0 | 0.0 | 0.0 | 0.0 | 0.0 | 0.0 | 0.0 |
| 1989 | 0.0 | 0.0 | 0.0 | 0.0 | 0.0 | 0.0 | 0.0 | 0.0 | 4.0 | 0.0 | 0.0 |
| 1988 | 0.0 | 0.0 | 0.0 | 0.0 | 0.0 | 0.0 | 0.0 | 0.0 | 1.0 | 0.0 | 0.0 |
| 1987 | 0.0 | 0.0 | 0.0 | 0.0 | 0.0 | 0.0 | 0.0 | 0.0 | 2.0 | 0.0 | 0.0 |
| 1986 | 0.0 | 0.0 | 0.0 | 0.0 | 0.0 | 0.0 | 0.0 | 0.0 | 0.0 | 0.0 | 0.0 |
| 1985 | 0.0 | 0.0 | 0.0 | 0.0 | 0.0 | 0.0 | 0.0 | 0.0 | 0.0 | 0.0 | 0.0 |
| 1984 | 0.0 | 0.0 | 0.0 | 0.0 | 0.0 | 0.0 | 0.0 | 0.0 | 0.0 | 0.0 | 0.0 |
| 1983 | 0.0 | 0.0 | 0.0 | 0.0 | 0.0 | 0.0 | 0.0 | 0.0 | 0.0 | 0.0 | 0.0 |
| 1982 | 0.0 | 0.0 | 0.0 | 0.0 | 0.0 | 0.0 | 0.0 | 0.0 | 0.0 | 0.0 | 0.0 |
Distribution map
Distribution - 2017
This map shows the observed distribution of the Common Bronzewing for 2017.
The red circles are the grid cells where Common Bronzewing have been reported.
The transparency of the red circles indicate how many surveys sheets were submitted for that grid cell; the darker the red the more reliable the data. Of the 315 grid cells with reports, 83 had only one sheet; an example is grid number J3.
The size of the circle represents the reporting rate. The maximum reporting rate for Common Bronzewing was 100.0% (eg grid number J3) and the minimum was 0.1% (eg grid number L14). 
Distribution - all years
This map shows the observed distribution of the Common Bronzewing for all years.
The red circles are the grid cells where Common Bronzewing have been reported.
The transparency of the red circles indicate how many surveys sheets were submitted for that grid cell; the darker the red the more reliable the data. Of the 703 grid cells with reports, 55 had only one sheet; an example is grid number I29.
The size of the circle represents the reporting rate. The maximum reporting rate for Common Bronzewing was 100.0% (eg grid number I29) and the minimum was 0.2% (eg grid number L14). 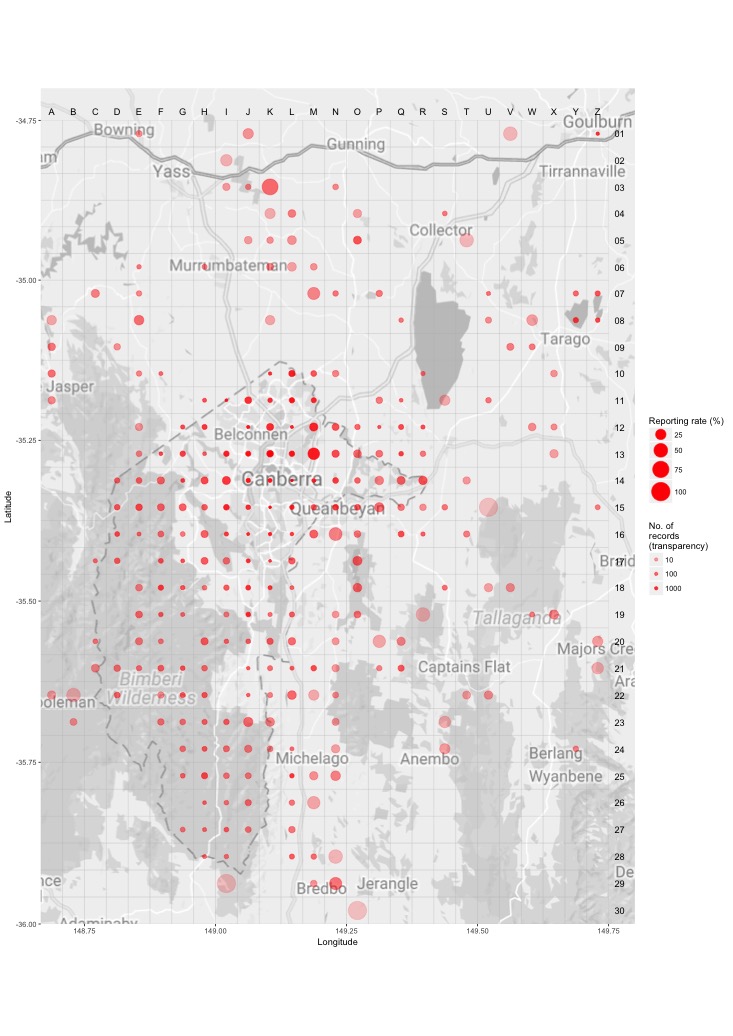
Breeding map
Breeding - 2017
This map shows the breeding distribution of the Common Bronzewing for 2017.
The red circles are the grid cells where breeding activity for Common Bronzewing have been reported.
The size of the circle represents the number of reports. 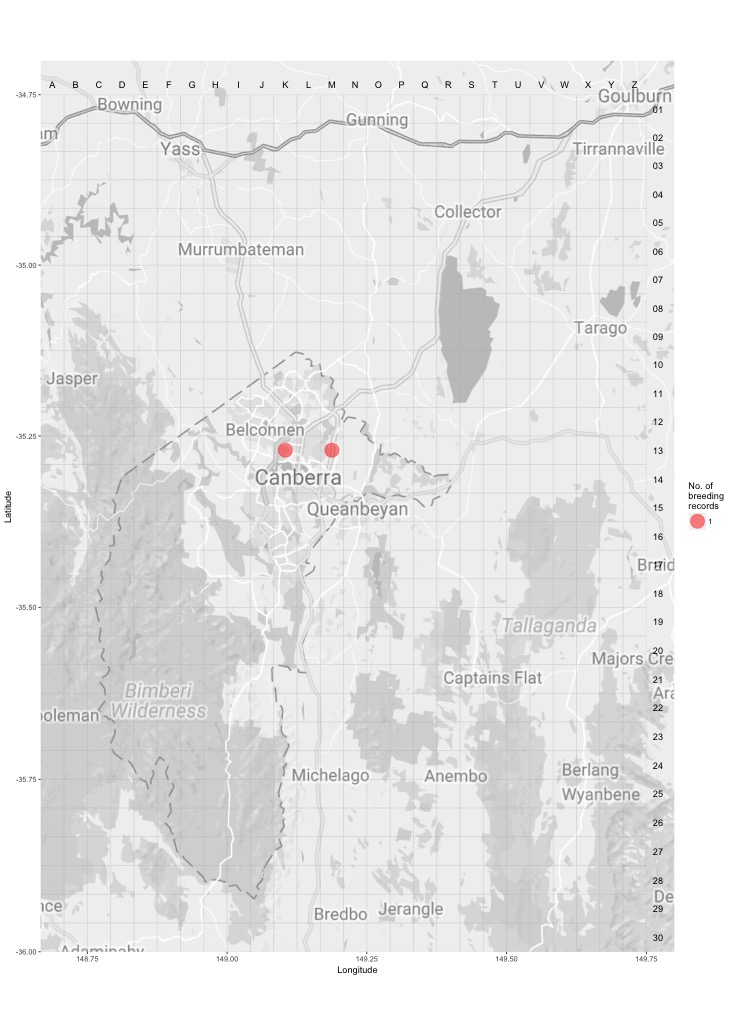
Breeding - all years
This map shows the breeding distribution of the Common Bronzewing for all years.
The red circles are the grid cells where breeding activity for Common Bronzewing have been reported.
The size of the circle represents the number of reports. 